I just want to start a flame graph in your heart!


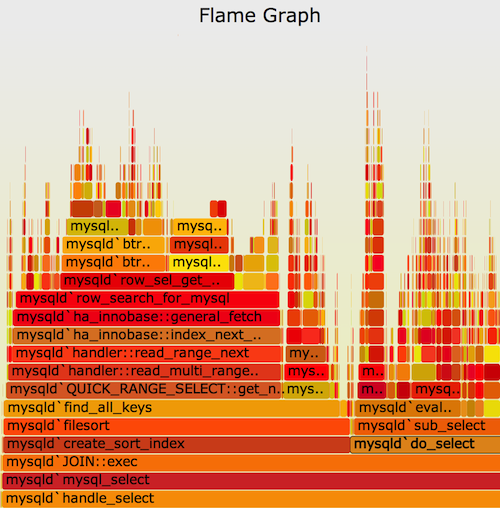
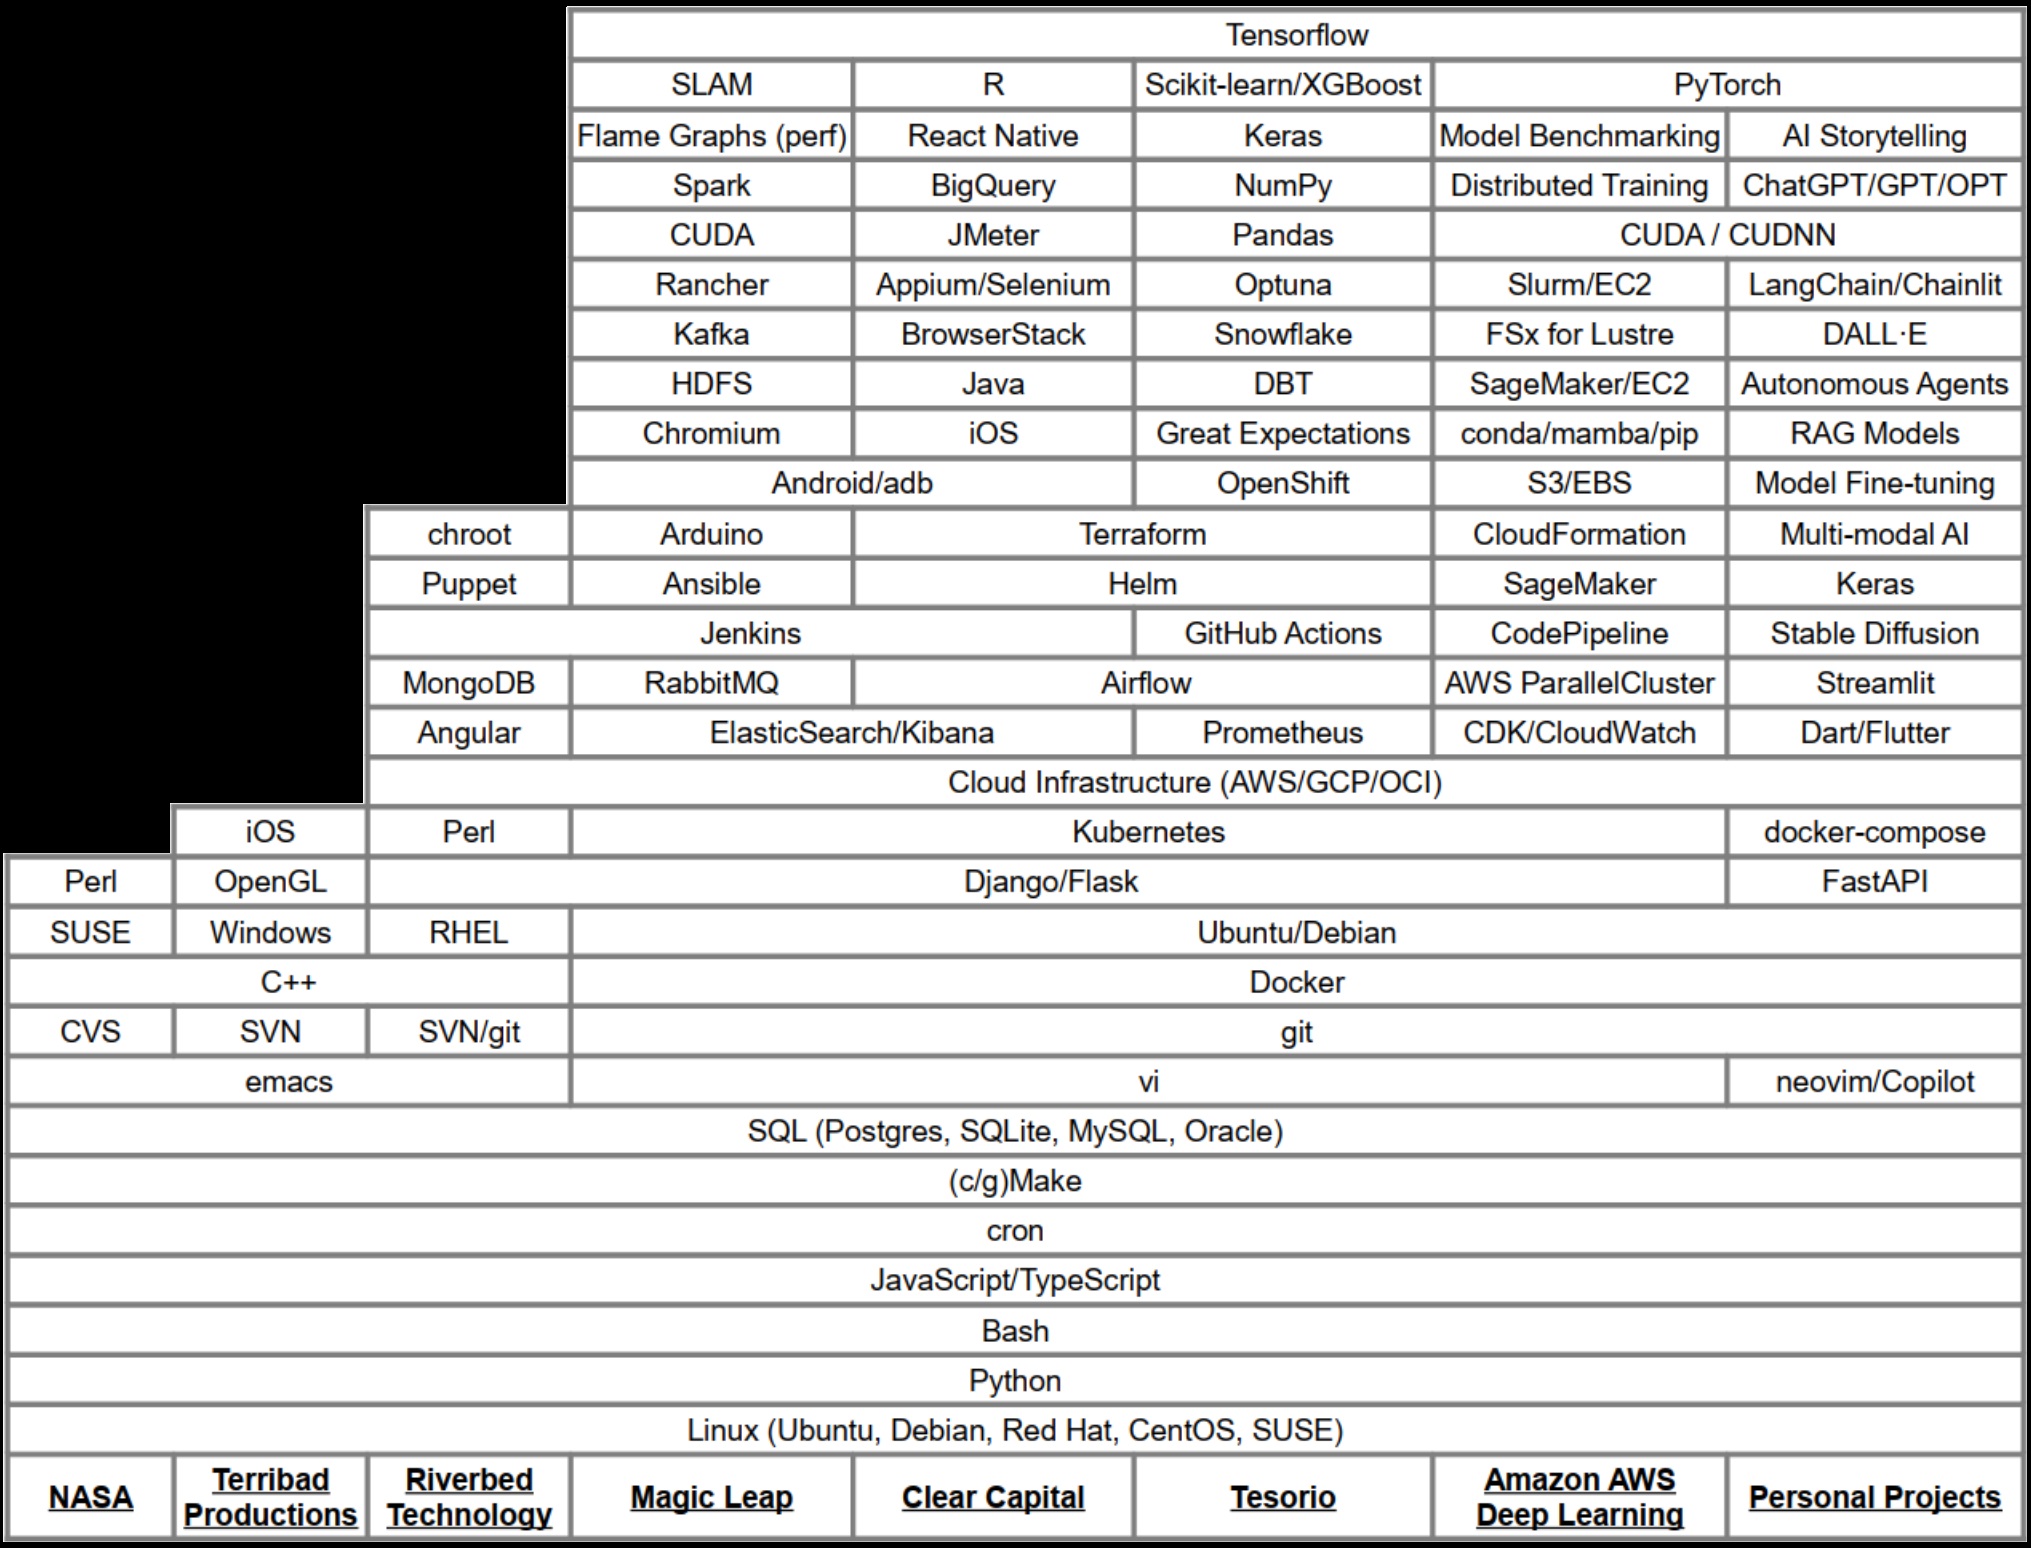
Danny’s Career Flame Graph

While working on the Magic Leap One, one issue was just figuring out what our hardware could really do. At the time, we hadn’t even settled on a final form-factor for our upcoming mixed reality headset that was meant to change the world (or at least maybe replace a few cell phones or TVs). But we knew we’d be using a special version of Nvidia’s Tegra chipset, similar to what was used in the Nintendo switch.

Besides being a bit aghast that our next-generation headset still had to conform to the laws of thermodynamics and include a small spinning fan, it was hard to argue with the graphics power we could get out of these little Nvidia boards. Only a year earlier, we’d started testing mixed reality applications on custom headsets running off of desktops with Nvidia Titan X video cards connected by a bundle of about 12 cables. So achieving even a similar experience with hardware that could fit in (ok maybe on…) your pocket was dang impressive.

That was all well and good if you wanted to run one application at a time, but Magic Leap one was meant to be more than that. We wanted users to be able to run apps concurrently in the foreground and background. Why couldn’t your AI Tamagotchi Dog run around with you while you slay some dragons in your living room? Maybe they could even help! At least that was the dream back then.

To make the dream a reality though, we had to really understand what our new hardware could do. Luckily, another engineer on my team had spent some time working at Intel with a linux tool called perf. Perf is an awesome profiling tool for linux that allows you to gather information about running processes. This data could then be fed into some special tooling to create flame graphs. “Flame graphs are a visualization of profiled software, allowing the most frequent code-paths to be identified quickly and accurately.” – http://www.brendangregg.com/flamegraphs.html

Those flame graphs turned out to be an amazing tool to really pick apart what’s happening when a piece of software is running, function call by function call. They allowed us to identify what was taking up time and resources and make really great use of the hardware we had. Ever since, I’ve thought that flame graphs could be used for even more though. There are very few other visualizations I’ve run across that can easily communicate that much information in such a small space.

So, I decided to apply the concept to my own career. What would the flame graph of all the skills I’ve accumulated look like? Well, the image above is the end result of that thought experiment. It turns out that the concept maps very well from a program run to a career. The granularity is a bit different, and the meaning of the y-axis is a bit more fuzzy, but the end result is actually a really good snapshot of what I’ve been working on over time. You can see what tools I’ve added to my toolbelt over time, and it’s easily searchable to boot.

So, have a look, let me know what you think! Maybe create your own career flame graph too!

Probing the Oculus Quest with Android tools

I recently started attending my local AR/VR meetup. It’s been a fun way to get back into the swing of working on my own projects. Obviously for anyone reading this blog, I’ve not been too focused on personal projects recently. So, I got inspired after a meetup discussion on side-loading apps on the Oculus Quest (see a similar tutorial at https://uploadvr.com/how-to-sideload-apps-oculus-go/ ).

I’d heard before that the Quest was a glorified Android phone with a headset wrapped around it. What I didn’t realize was that is also largely true from a software perspective. The Quest appears to just be running a custom version of Android. This is similar to systems I’ve worked with in the past, including the Magic Leap One. In the case of the Magic Leap One though, the headset connects to the development machine using a custom toolchain. It appears that Facebook has taken a less custom route as they’re using the default Android toolchain. This means that once the headset is properly configured, we can play around with the standard Android tools and actually get back some results (see the Quest developer setup docs for details https://developer.oculus.com/documentation/quest/latest/concepts/mobile-device-setup-quest/?locale=en_US ). It’s worth noting that I couldn’t get adb to work with the Quest on Linux, so I had to use a Windows PowerShell command prompt to get this working.

Once you get your device set up and connected to your local adb, you can run the command “adb devices” via PowerShell and you should see something like this:

adb devices output
If you see “unauthorized” instead of “device” you probably need to turn on “developer mode” on your Quest

Now that we have our device connected to a PC, lets poke around and see what we can find. We’ll do this with another adb command “adb shell”. This command gives us a command prompt running on the Quest device itself.

In particular, we want to get some general information about the device. So, we’ll use the Android command “getprop” to print out the Quest’s environment information. This gets you a ton of information about your Quest device, from the device serial number, to the OS version your Quest is running. If we want to narrow down our data to just information about the build running on our Quest device, we could use grep.

Looking over the build information, we can see some cool things hidden away from the normal Oculus Quest interface. We can see the exact build string is “oculus/vr_monterey/monterey:7.1.1/NGI77B/377480.16500.0:user/release-keys”. We can see our current SDK version is 25. We can even see which Facebook build machine our build ran on “sandcastle912.atn5.facebook.com”.

Now, this is all well and good, but what if we want to see what is happening on our device? This is where the Android tool “uiautomatorviewer” comes into play. It allows us to take a screenshot of our Android device, in this case an Oculus Quest, and also get a little bit of metadata about what’s on the screen.

First, we launch the uiautomatorviewer tool via the command line. Depending on how you installed your Android tools, you may need to specify an absolute path. But in my case I can just launch the .bat directly since the tool’s directory is in my Windows path.

Use “CTRL+C” to kill the uiautomatorviewer tool

This will launch a new window where we can take screenshots from our Quest. There are a few gotchas though. First, make sure something is actively displaying on the Quest. When the device does not recognize that it’s being worn, it’ll turn off the display and you’ll just see a screenshot of a black screen. Pro tip, use your finger to cover the IR sensor on the inside of the Quest headset to trick it into thinking it’s on your head. From here, simply click “Device Screenshot (uiautomator dump)” to take our screenshot.

Exercise for the reader: click around those FrameLayout nodes for a bit of extra (though not super useful) screen data

In this case, I took a screenshot of the home screen of the awesome VR game Beat Saber. As with any Android app, we get a bit of metadata from the screen as well. In the case of a normal Android app, we’d be able to see metadata about each element displayed on the screen. On the Quest, we only see a single view for the combined left/right eye image. This view does list the current application as “com.beatgames.beatsaber”, but unfortunately we don’t get much more than that. This is not particularly surprising given that we’re in a 3D application, rather than a standard 2D Android app.

Hopefully in the future, Oculus will add some kind of cool picking logic so that we can select individual UI elements even in VR, but it’s early days yet for this kind of tooling. I’m honestly impressed that these tools all work in the first place. It’s clear Facebook has tried to keep integration with the existing Android development toolkit working, which is probably a good move. It’ll be great to see how this tooling evolves moving forward. In the meantime, at least we can take great high-res screenshots!

Full resolution goodness!